Debugging Webpages
Web Inspector
You can use the Web Inspector to debug webpages over the local network.
The JavaScript console should only be used in non-production presentations and it should be disabled before you publish in a production environment because it uses more memory, which can lead to frequent reboots, and it compromises security.
Enabling/Disabling the Web Inspector
As of BOS version 8.5.31 and later, both a presentation setting and a registry setting (enable_web_inspector registry key in the html section) are required to enable the Web Inspector. The various methods you can use to enable these settings are described below.
Through the Presentation Setting:
- BrightSign Author: In your BrightSign Author presentation, go to Presentation tab > State Properties > Options and select Enable Javascript console.
- BrightAuthor Classic: In your BrightAuthor Classic presentation, go to File > Presentation Properties > HTML and check the Enable Javascript console box. See the "inspector_server" in roHtmlWidget for more information.
- BrightScript: When creating the roHtmlWidget instance, include the inspector_server initialization parameter and specify a port number.
Through the Registry Setting:
These settings are only required as of BOS version 8.5.31 and later.
- Local/Remote DWS: Select Allow JavaScript console in the Chromium Debugging section of the DWS.
- Local DWS APIs: Set PUT /v1/diagnostics/chromium-debug/ to true to enable the Web Inspector. See this page for more information.
- BrightScript: Set the enable_web_inspector registry key to “1” to enable the Web Inspector for Chromium on the player (if it is set to “0” or nothing, the Web Inspector is disabled). For example:
reg = CreateObject("roRegistrySection","html")
reg.Write("enable_web_inspector", "1")
reg.Flush()
To disable the Web Inspector, disable either the presentation or registry setting you used to enable it.
If you want to change the Web Inspector port, you must edit the configuration of roHtmlWidget. See the "inspector_server" in roHtmlWidget for more information.
Enabling the Web Inspector creates a security vulnerability on BrightSign players. See this page for more details.
Inspecting a Webpage
Once HTML content is running on a BrightSign player, follow these steps to inspect it:
- Open Chrome on a desktop computer connected to the same local network.
- Enter the following URL into the address bar: chrome://inspect/devices
- In the Devices section, click Configure.
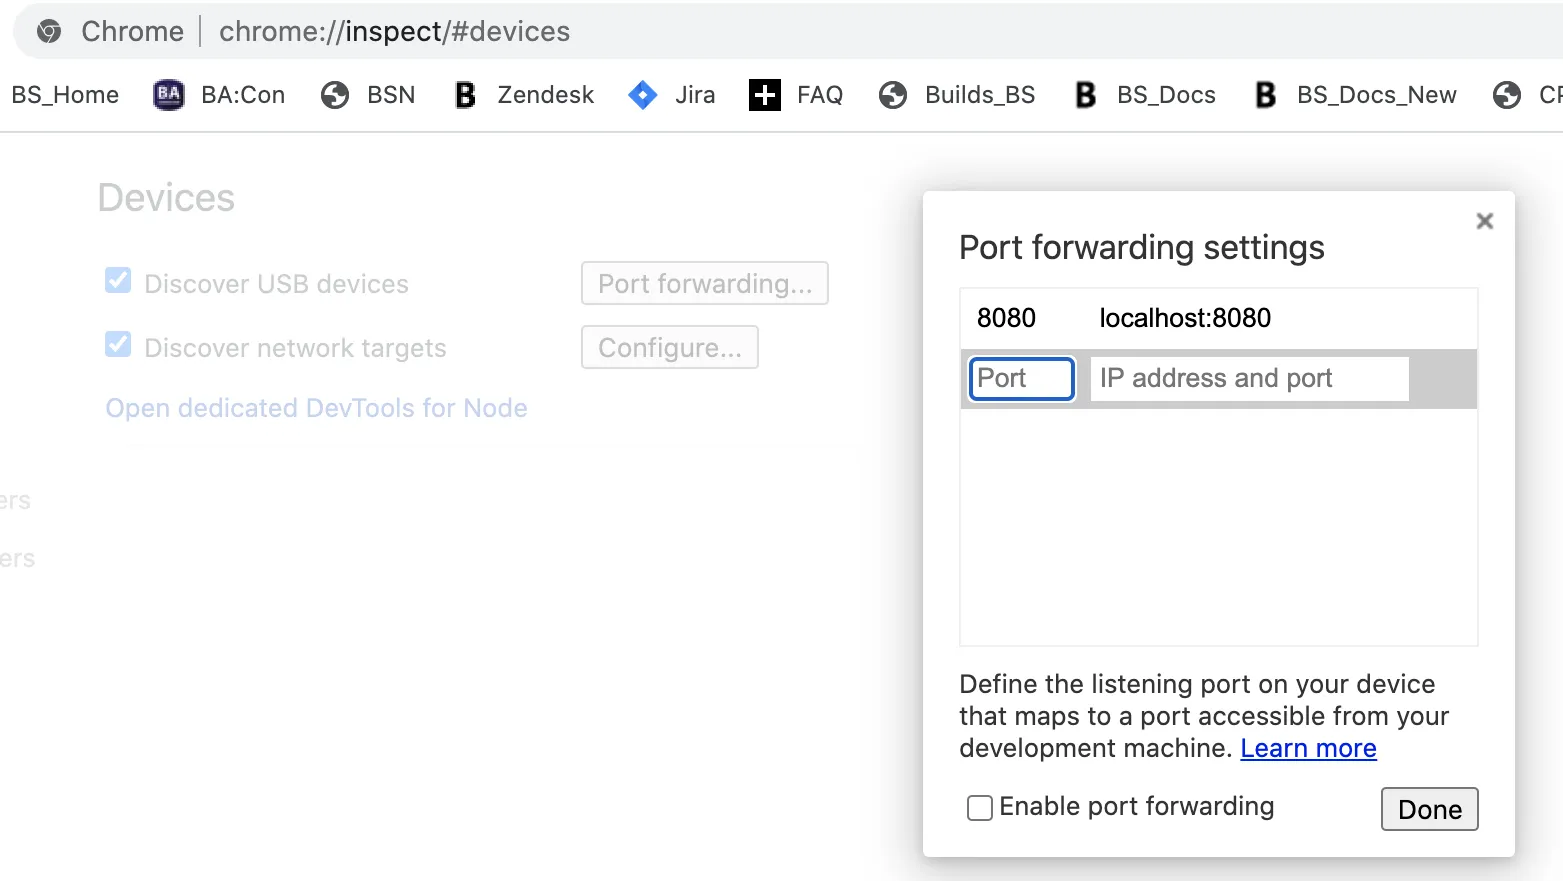
- Enter the player IP address and Web Inspector port in the field (see the image below). The page(s) being run on the BrightSign player will be displayed at the bottom of the page.
- If you don't know the player IP address, power on the player with the microSD card (and other storage devices) removed. After a few moments, the IP address will be displayed on screen.
- If you enabled the Web Inspector in BrightAuthor, use port 2999 (e.g. http://192.168.1.62:2999/).
- Click the Inspect button next to a page. A debugging session will be launched in a new window. Unlike local pages, the page contents are not displayed in the left pane, but the inspector window on the right can be used to debug the page.
Adding more than one device in your list can cause performance issues, especially if the devices are not online, because the Chrome client will continue to search for any offline devices.
Chromium Version Compatibility
Because BrightSign players use an older version of Chromium than recent desktop versions, newer desktop Chrome releases may not work with the Web Inspector. If you're having trouble using the Web Inspector with your version of Chrome, download and install one of these versions:
If you're using the Web Inspector to manually step through JavaScript code, encountering an uncaught error in the debugger may cause the player to crash. This is a known bug with the Web Inspector.
A larger collection of supported Chromium downloads can be found here.
Trace Events
The Chromium TraceEvent system allows you to debug JavaScript memory leaks, performance issues, and rendering problems. This feature is available in firmware versions 7.0.82 and later. Unlike PCs, where the trace/debugger is run in the same browser as the content, BrightSign players write JSON trace files to the local storage, which you can then import to Chrome on your PC.
When trace events are enabled on a BrightSign player, Chromium captures trace messages to a circular buffer. The player takes regular snapshots of this buffer and writes them to the root directory of the microSD card or SSD as JSON files.
The TraceEvent system can easily generate gigabytes of log data on local storage, so we recommend disabling it in production environments.
See this StackOverflow page for more information about memory leaks when using console.log to log complex objects.
Creating a TraceEvent Directory
Before enabling the TraceEvent system, create a directory named "brightsign-webinspector" in the root directory of the microSD card or SSD on the player. If this directory is missing, the player will not record trace events when they are enabled in the registry. Conversely, you can disable trace events by deleting the "brightsign-webinspector" directory from the storage device.
Enabling the TraceEvent System
The TraceEvent system is enabled and configured by writing to the BrightSign player registry (via BrightScript or JavaScript). To enable the TraceEvent system, write the following keys to the html section of the registry:
- tracecategories string: A comma-separated list of trace event categories to enable. The category names are documented in the link below.
- tracemaxsnapshots int: The maximum number of JSON-trace snapshot files in the "brightsign-webinspector" directory. When the limit is reached, the counter wraps around and begins writing over the oldest trace file.
- tracemonitorinterval int: The frequency (in seconds) with which the player will take snapshots of the TraceEvent buffer. We recommend 60 seconds as a default value.
Example (JavaScript):
var registryClass = require("@brightsign/registry");
var registry = new registryClass();
registry.write("html", {
    "tracecategories": "toplevel,blink_gc,disabled-by-default-memory-infra,disabled-by-default-blink_gc,disabled-by-default.skia.gpu.cache",
    "tracemaxsnapshots": "25",
    "tracemonitorinterval": "60"
}).then(
    function() {
        console.log("Write Successful");
    });
Viewing Trace Events
Follow these steps to view the trace events:
- Transfer the JSON trace files from the "brightsign-webinspector" directory to your PC.
- Open chrome://tracing on your PC Chromium instance.
- Import the JSON trace files.
You can merge multiple trace files; however, in a long trace capture, there will be too many trace events to view at once (you'll likely need to write a script to process them).
Additional Documentation
See the following links for further explanation of trace events: