Debugging HTML/Node Apps
Chromium or Node inspectors can be used to debug Html and Node applications that run on BrightSign players. See the sections below for more information about how to use each of these tools.
Chromium Inspector
This example uses Visual Studio Code. You can store your application on the Live Server module if you use VS Code, or on a local server.
This only should be used during development, and is not recommended for applications deployed to a player in the field unless you can restart the player or control the runtime.
Prerequisites
- Connect to your player through a serial connection (see BrightSign Shell or Serial Port Configuration for more information).
- If you have a local HTTP server on your computer, put your application on the server and point the BrightSign player to it. Otherwise, you'll have to copy the application code onto the player.
- Download or install this REST client for VS Code, which lets you use keyboard shortcuts to quickly upload files to the player.
- Open your Chrome browser and go to this URL: chrome://inspect/#devices.
Enabling the Debugger
- Open your autorun in a code editor.
- Enable debug in the registry by adding the following lines to your autorun:
debugrs = createobject("roregistrysection", "brightscript")
debug = debugrs.read("debug")
if debug <> "1" then
	debugrs.write("debug","1")
	debugrs.flush()
	'stop
	RebootSystem() 'reboots player first time it's changed
end if
3. To test the debugger, type Ctrl-C at the BrightScript> prompt in the serial control window. The prompt will change to BrightScript Debugger>. Type exit to leave the debugger.
4. Enter the code below in your autorun. The --inspect-brk flag will let you quickly see what variables are in scope, their values, and the call stack at specific places in the script.
m.node.js = CreateObject("roNodeJs", "sd:/main.js", {message_port: m.msgPort, node_arguments: ["--inspect-brk=0.0.0.0:2999"]})Running the Debugger
- Type script autorun.brs at the prompt to restart the autorun (you don't need to reboot the player when you make changes if you use this method).
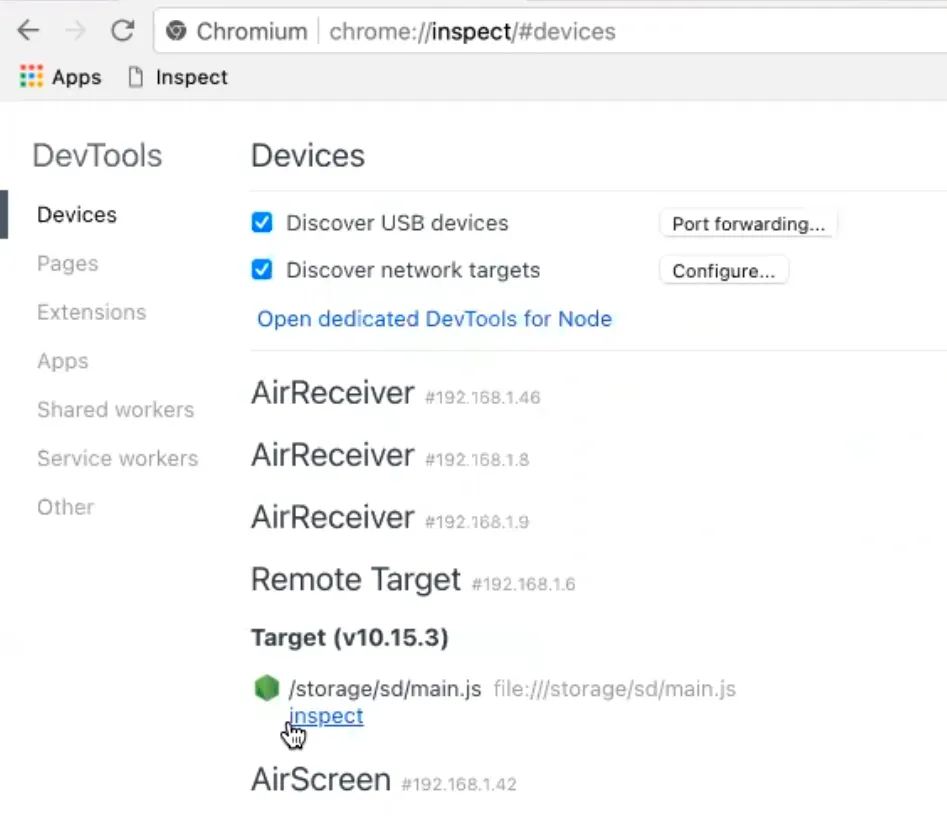
- Once the autorun has restarted, go to the Chromium inspector. Select Configure... to access the Node and HTML instances of the player. You will need the IP address of the player to inspect the Node process.
- Because we added the roNodeJs --inspect-brk parameter in the autorun, the execution of the script is paused at the first line. Select inspect to launch the debugger (see Image 1). Press the resume script button in the debugger to run your JavaScript code and play the video on your screen.
- Enter the debugger keyword on a separate line in your JavaScript code to set a breakpoint. You will need to close the app and restart it before the breakpoint will be activated.
BrightSign Debugger (Node Inspector)
The BrightSign debugger is useful if you want to upload the application to the player for debugging rather than an HTTP web server. Once it has been uploaded to the player, the application can be restarted (if you do this, there is no need to restart the player).
To do this:
- Select Ctrl-C to drop to the BrightScript Debugger prompt.
- Type exit to get to the BrightSign prompt.
- Type script autorun.brs to restart the app.
Features in Recent OS Versions
Type node with no parameters to get an interactive Node shell, and then enter JavaScript, which is evaluated immediately:
BrightSign> node
> process.release
{ name: 'node',
  lts: 'Dubnium',
  sourceUrl:
   'https://nodejs.org/download/release/v10.15.3/node-v10.15.3.tar.gz',
  headersUrl:
   'https://nodejs.org/download/release/v10.15.3/node-v10.15.3-headers.tar.gz' }
>Type Ctrl-D to exit Node and return to the BrightSign prompt, or you can give it the name of a script to run:
BrightSign> node sd:/hello.js
Hello world
BrightSign>If you want to attach a remote debugger to your Node process, you can pass --inspect as normal. It will show you the URL for the debugger:
BrightSign> node --inspect=0.0.0.0:1234 sd:/hello.js
Debugger listening on ws://0.0.0.0:1234/c67ca30e-388b-49b2-baf4-9924d94f0ac6
For help, see: https://nodejs.org/en/docs/inspector
Hello world
Features Requiring OS 8.3.1 or Later
If you want to debug interactively at the console, use node inspect (without dashes). It will start the inspector and then connect to it locally:
BrightSign> node inspect sd:/hello.js
< Debugger listening on ws://127.0.0.1:9229/2c63116d-d1d4-4248-81b4-718217bef35e
< For help, see: https://nodejs.org/en/docs/inspector
< Debugger attached.

Break on start in file:///storage/sd/hello.js:1
> 1 (function (exports, require, module, __filename, __dirname) { console.log("Hello world");
  2
  3
debug>
If you have a single-file or webpacked program that's located on a remote host, you can pass an http or https URL to Node. BrightSign will fetch the file and run it (this doesn't work if the program needs other resources that it expects to find in the cwd).
BrightSign> node http://192.168.82.66/test.js
Hello
BrightSign>
If you want to run your program inside Chronode (the Node.js that is embedded in Chromium) rather than in the standalone Node, use htmlplay chronode. This is similar to htmlplay, except that it expects to be given the URL to a .js file rather than an html site:
Note that in this case, the output goes to the system log and not to the shell console.
BrightSign> htmlplay chronode http://192.168.82.66/test.jsIf you want to attach the debugger to a program or a website that you've launched with htmlplay, set this option before loading the page:
BrightSign> htmlplay params inspector-port 1234
BrightSign> htmlplay http://www.brightsign.biz/